INTRODUCTION
The gap between the richest 10% and the poorest 10% of the population is a key indicator of socioeconomic sustainability and requires special attention. It reflects not only issues of "equity" in income distribution within a country, but also the quality of institutions, the structure of labor markets, access to human capital, and the economy's ability to translate growth into shared (Sitthiyot and Holaust 2020).
It is important to note that discussing inequality solely in terms of "the incomes of the rich and the poor" is often insufficient. In applied research, incomes and living standards are measured and compared both across individual countries and across groups of countries. In this logic, the central question becomes: how different countries and blocs (the Global North, the Global South, BRICS+) shape the conditions under which the relationship between the top and bottom deciles is formed and reproduced.
Global inequality – the gap between Global North and the Global South has grown for the first time in 25 years. Low and lower-middle income countries are set to pay nearly half a billion US dollars a day in interest and debt payments between now and 2029, and they are having to make severe cuts to spending to be able to pay their creditors. Meanwhile, the dramatic increase in extreme wealth witnessed since 2020 has become set in stone. This wealth is concentrated in the Global North. Only 21% of humanity lives in the countries of the Global North, but these countries are home to 69% of private wealth, and 74% of the world's billionaire wealth (Oxfam 2024).
However, still emerging and even developing economies have been building up their own wealth elites. The UBS in its Global Wealth report points that the world became richer in 2024 but it's a mixed picture. After a decline in 2022, global wealth rose again in 2024 on the heels of a buoyant 2023. In 2023, the rebound in wealth was led most strongly by growth in Europe, the Middle East and Africa. By contrast, in 2024 wealth growth was tilted strongly towards North America, driven by a stable US dollar and upbeat financial markets (UBS, 2025).
In this article, we briefly review the historical evolution of inequality (from agrarian societies to the global economy). We then examine contemporary income differences between country blocs and their relationship to the economic geowth. Finally, in the discussion and conclusion, we explore the reasons for the persistence of these gaps and how they are influenced by growth, investment, and convergence.
The provided dataset contains GDP per capita data for 199 countries (2000–2024). These data do not directly measure decile incomes within countries; they are particularly useful for describing the macroeconomic environment in which decile gaps arise (the overall "size of the economic pie," government fiscal capacity, investment opportunities, etc.).
1. LITERATURE OVERVIEW
1.1 Historical Context: How the Logic of Inequality Has Changed
In agrarian systems, wealth was based primarily on land and control over rent. Upper classes (the elite, large landowners, and ruling classes) enjoyed stable advantages secured by law, tradition, and power. Lower classes lived in conditions of low productivity and income, but were highly vulnerable to shocks (crop failures, wars, and disease) and faced almost complete lack of mobility (Carocci 2011).
It is crucial to note that social mobility was limited: poverty and wealth were often reproduced through birth and status.
The industrialization of society created the basis for the gap between deciles: in the early stages, the return on capital (enterprises, finance, infrastructure) began to grow faster than the return on labor. Historical examples (19th-century Great Britain, the United States during its early industrialization, the Russian Empire) illustrate a typical trajectory: rapid growth in production and national wealth can coincide with high social polarization, when income redistribution and labor protection are very weak, de-facto nonexistent, or extremely poorly provided (Lindert and Nafziger 2014).
After two world wars, many developed countries created mechanisms that partially narrowed the gap within society: progressive taxation, expanded education, social benefits, stronger trade unions, and accessible healthcare. This made it possible to form a broad middle class and reduce the scale of poverty among the overwhelming majority of the population (Palme 2006).
Since the 1980s, trends that often lead to a widening gap between the "upper" and "lower" strata of the population have intensified: global capital mobility, the growing role of financial assets, the skills premium driven by technological advances, and rising housing and asset prices. At the same time, globalization has stimulated growth in parts of the developing world where poverty was endemic and there was no possibility of changing the situation without external changes, creating a dual picture: partial convergence between countries can coexist with increasing inequality within countries (Dollar 2005).
Our research uses the "Global North," "Global South," and BRICS+ blocs, a classification increasingly referenced not only in policy discussions but also in academic ones. This classification is useful because it links economies to historical development paths, colonial legacies, institutional models and state capacity, each bloc's position in global value chains, investment potential and demographic dynamics, and the potential for convergence -catch-up development (Seniuk 2019).
An important note: the boundaries of these blocs are not always clear-cut (for example, high-income economies based on the financial sector or resources may be considered as the “South” in a political-geographical sense). Therefore, it is more accurate to view them as analytical frameworks rather than as rigid natural categories.
In the Global South, the range of indicators is extremely wide, encompassing both very low-income countries and high-income countries (often driven by resource extraction or finance). This has a crucial impact on deciles: the same deciles do not imply the same conditions for the bottom decile. In some countries, poverty is linked to survival and access to basic needs, while in others, it is linked to housing affordability, job quality, and overall inequality in asset distribution (Ahmad 2025).
1.2. Historical Perspective by Bloc and Current Issues: Growth, Investment, Convergence
Historically, many economies in the wealthy countries of the Global North industrialized earlier and developed strong institutions and human capital. This ensures high per capita GDP and a greater ability of the state to support low-income groups through public subsidies. However, in recent decades, many countries in the North have faced the growing role of capital income (stocks, housing) and asset concentration in the top decile, technological polarization of labor markets (skill premiums), a housing affordability crisis in large cities, political sensitivity to migration, and "inequality of opportunity." (Piketty and Zucman, 2014).
The logic of deciles in the Global North: the bottom decile may have relatively good access to basic services by world standards, but soaring housing costs, job insecurity, and weak real income growth can exacerbate feelings of alienation from the top decile.
BRICS+ is of significant analytical importance because it brings together large populations and markets (India, China), resource and energy production centres (Russia, Saudi Arabia, Iran), and regional leaders (Brazil, South Africa, Egypt, Ethiopia, UAE). Its potential for convergence depends on infrastructure investment, productivity growth, industrialization, reindustrialization, human capital and technology development, and integration into international trade and logistics. However, catch-up growth is constrained by institutional risks, sanctions and geopolitics (for some members), commodity dependence and rent traps, uneven modernization across regions, large gaps between formal and informal labor markets (especially in large developing member countries), and unequal access to education and healthcare (Ncwadi 2025).
The logic of deciles in BRICS+: even with rising GDP per capita, the bottom decile may grow slowly if growth is concentrated in capital-intensive sectors, megacities, or among groups with privileged access to education and assets.
1.3. Global South: diversity of trajectories and “bottlenecks” for convergence
Countries in the Global South represent very different models: from fast-growing export economies to countries struggling with conflict, demographic pressure, weak fiscal bases, and low productivity.
Factors that facilitate growth include investment in basic infrastructure (energy, transport, communications), improved education and healthcare, strengthened institutions, integration into global value chains, urban development, and labor market development (Ndubuisi and Owusu 2023).
Factors that limit progress include low agricultural productivity, large informal sector employment, weak institutions and limited opportunities for wealth redistribution, external shocks (commodity prices, climate, debt burden), brain drain, and capital shortages.
2. DATA AND METHODS
The primary objective of this paper is to examine the evolution of income disparities across countries from 2001 to 2024. Acknowledging the transition of various countries, three principal groups were outlined in line with the IMF's classification. The Global North (GN) comprises advanced economies; the BRICS+ are considered emerging economies; and the Global South comprises both emerging and developing economies. For comparison, the real GDP per capita in PPP was used over the 2001-2024 period. As a data sample, the World Bank public database was used. Data processing and statistical inference were performed in Stata.
As the primary research method, linear panel regression with dummy variables was employed. Formally, we may write:
Where is dependent variable (e.g. GDP per capita in logarithm), GN- dummy variable (Global North), GS - dummy variable (Global South), where the BRICS+ is considered as a reference category, year and – represents the error term over - country and -period. We consider that model should fill attributes of the classical regression model. The model would reveal the group-level income differences over the researched period. As a main estimation method panel model with random effects using robust estimators are preferred. Additionally diagnostics of the model is provided in the annexe part.
3. RESULTS
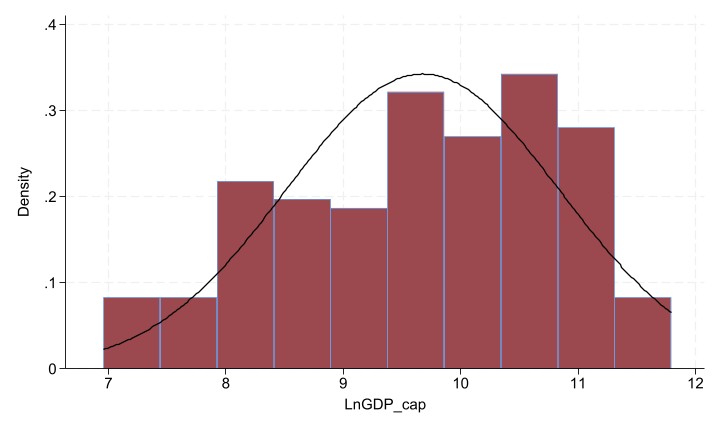
For the research purposes we present the basic statistical diagnostic of data. The histogram shows the probability distribution of data sample, the logarithm of GDP per capita in PPP in 2024.
Source: author’s processing based on World Bank 2026
The Fig.1 the probability distribution of data sample. We may consider departure from the normal distribution. It may be observed multimodal, slightly left-skewed distribution of GDP per capita in PPP across the countries in 2024 respectively.
Next, the main results showing the group-level income differences are presented. Table 1, shows income level comparisons between the country groups (GN, GS) using the BRICS+ as the reference group.
| GDP_cap | Coef. | St.Err. | t-value | p-value | [95% Conf | Interval] | Sig |
| Country_group : ba~+ | 0 | . | |||||
| GN | 1.207 | .314 | 3.84 | 0 | .591 | 1.822 | *** |
| GS | -.471 | .321 | -1.46 | .143 | -1.1 | .159 | |
| 2002 | .02 | .004 | 5.07 | 0 | .012 | .027 | *** |
| 2008 | .218 | .015 | 14.22 | 0 | .188 | .248 | *** |
| 2014 | .3 | .021 | 14.27 | 0 | .259 | .341 | *** |
| 2020 | .326 | .026 | 12.66 | 0 | .275 | .376 | *** |
| 2024 | .45 | .03 | 15.12 | 0 | .392 | .509 | *** |
| Constant | 9.336 | .313 | 29.83 | 0 | 8.723 | 9.949 | *** |
| Mean dependent var | 9.488 | SD dependent var | 1.182 | ||||
| Overall r-squared | 0.345 | Number of obs | 4717 | ||||
| Chi-square | 1521.045 | Prob > chi2 | 0.000 | ||||
| R-squared within | 0.431 | R-squared between | 0.336 | ||||
| *** p<.01, ** p<.05, * p<.1 | |||||||
Adjusted predictions Number of obs = 4,717 Model VCE: Robust Expression: Linear prediction, predict()
| Delta-method | ||||||
| Margin | std. | err. | z | P>z | [95% CI] | |
| cnr_gr | ||||||
| BRICS+ | 9.591 | 0.308 | 31.100 | 0.000 | 8.987 | 10.196 |
| GN | 10.797 | 0.054 | 198.190 | 0.000 | 10.691 | 10.904 |
| GS | 9.123 | 0.087 | 104.510 | 0.000 | 8.952 | 9.294 |
Source: author’s research
The constant represents the mean income of the BRICS+ countries, whereas the coefficients represent the income difference relative to BRICS+. Interestingly, in case of GN countries have GDP per capita in PPPs higher by 1.206 units relative to BRICS+, meaning , so GN countries are roughly 3.3 times richer than BRICS+ in average. The result is statistically significant. In case of GS countries, they have GDP per capital in PPPs lower by 0.468 log points than BRICS+, meaning , hence GS countries are 37% poorer than BRICS+ on average, however the result is not statistically significant. The unit panel root was not detected. Additionally, several years as regressors were introduced confirming statistically significant difference of the GDP per capita in average over the selected time periods.
In the annexe 1, results of the Breusch-Pagan LM test is presented. The Breusch-Pagan LM has confirmed that the random effects model should be preferred over the pooled OLS, thereby providing better statistical inferences.
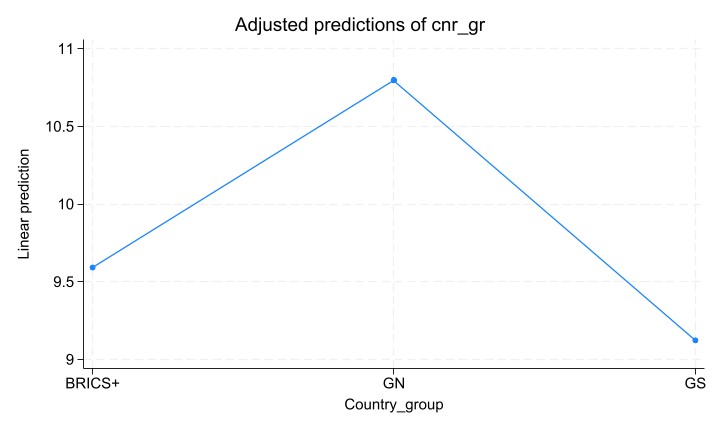
The table below shows the mean-level differences the country groups. The income-groups differences are all statistically significant. We may observe the differences through the marginplots.
Source: author’s research
The Fig.2 shows the marginplot of income-group differences. We may observe a meaningful differences between the country groups. On average the highest income represent the Global North countries (10,79) , in second come BRICS+ (9,591) group and finally the group of the Global South countries (9,23) measured as real GDP per capita in PPPs expressed in logarithms in 2024.
Source: author’s research
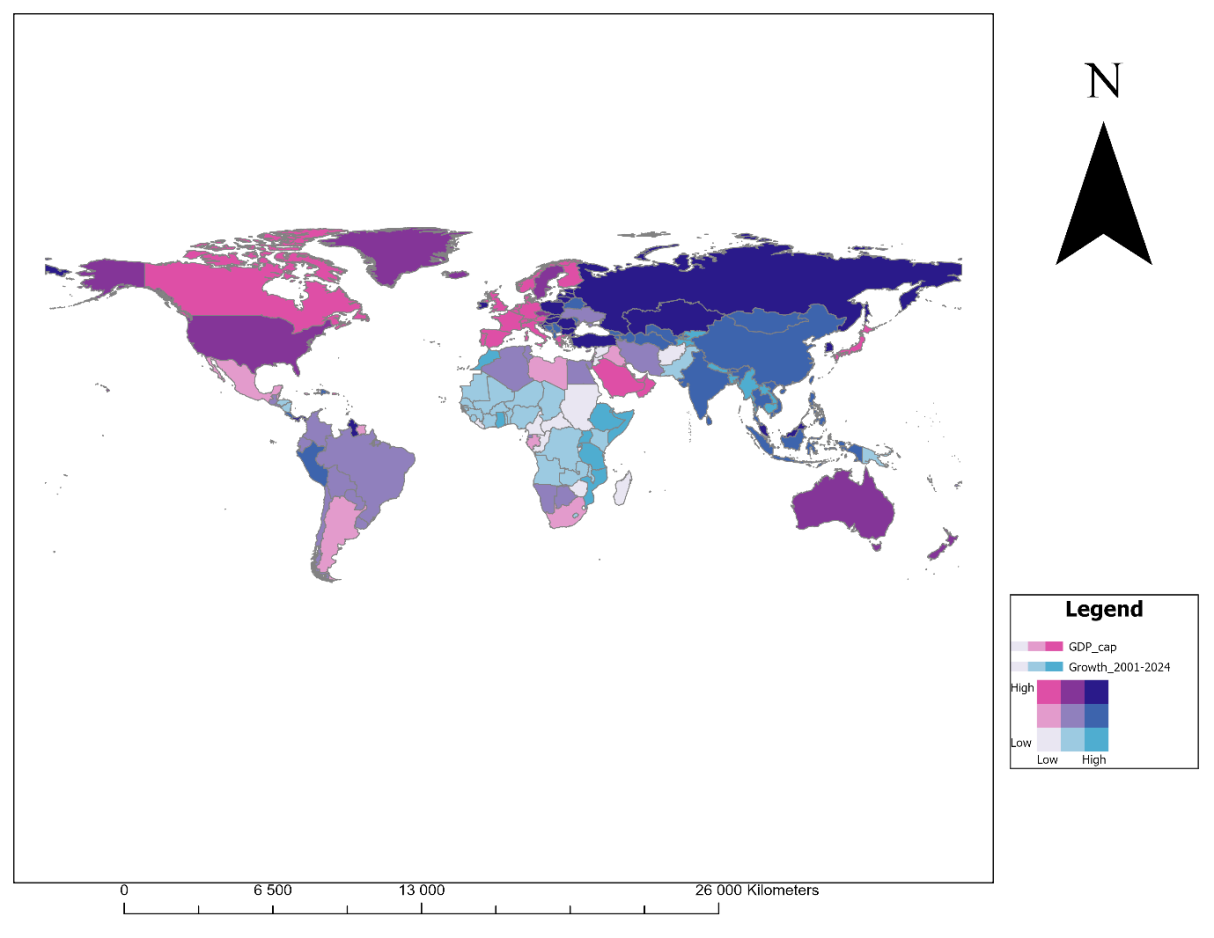
The Fig. 3 shows the global distribution of income and economic growth averaged over 2001-2024 over world countries. The choropleth map combines the income measures as real GDP per capita in PPS (in 2024) with average economic growth over the 2001-2024. The overall picture shows relatively mixed patterns. The GN countries mostly records high-low pattern, meaning high levels of income but low levels of growth, BRICS+ countries often represent the mixed pattern consisting of mediocre income and moderate-high economic growth. GS countries mostly record low-medium to low-high pattern, meaning low income but medium to high growth.
4. DISCUSSION
Gaps between deciles are formed against the background of the level of GDP per capita, the state's ability to redistribute wealth and resources, the structure of employment and productivity of the population, as well as access to education and capital.
Our dataset shows that differences between the blocs persist, but partial convergence is observed: the median indicator for countries in the Global South has increased from approximately 15% of the median indicator for countries in the North (2000) to 23% (2024). This is an important empirical finding for discussions about catch-up development in these countries.
Even when a country or bloc's economy is developing, the gap between deciles may narrow (if growth is inclusive and institutions are strong), remain stable, or widen (if growth is capital-led, concentrated in megacities, or driven by high-skill sectors). From a policy perspective, this means that cross-country convergence in GDP per capita does not guarantee convergence in social structure. For BRICS+ countries and some countries in the Global South, it's not just the "higher volume of investment" that matters, but also the type of investment: investment in infrastructure and human capital increases the likelihood that the bottom decile will gain access to productive jobs. Investments concentrated in rent-seeking or capital-intensive sectors with weak links to the labor market often only exacerbate the gap between deciles and have no impact on the well-being of the majority (Ofori et al. 2024).
On average, countries in the Global North have stronger institutional instruments to support the poorest groups (tax deductions, subsidies, and a wide range of public services). However, the gap can widen due to the concentration of assets in the hands of corporations or wealthy individuals, as well as rising housing costs. In countries in the Global South and some BRICS+ countries, institutions often become a major bottleneck. With weak state capacity and a narrow tax base, even high economic growth may not lead to sustainable improvements in the situation of the bottom decile.
CONCLUSION
The relationship between the richest and poorest deciles cannot be fully understood and assessed without a country- and block-level approach, especially when empirical analysis is structured around groups of countries. Historically, inequality changes its forms over time, but essentially persists as a result of the interaction of technology, capital, institutions, and labor market structure.
The main objective of the paper was evaluation of income disparities between the global economies over 2001-2024 period. For simplification the country economies were aggregated into the three country blocks for providing the exact measuring. For the study purposes the cross-sectional data over countries and time series data over 2001-2024 were pooled to the panel using real GDP per capita in PPPs as a dependent variable and country groups dummy variables as control variables. The results point at statistically significant income differences between the GN vs. GS and BRICS+, but there was not statistically significant difference between the BRICS+ vs. GS.
Finally, the comparison between the economic growth and income across the countries shows the mixed pattern, pointing on slow growth of GN countries, whereas BRICS+ and GS countries logged mostly moderate strong to strong economic growth in average. Hence, the catch-up effect between the BRICS+, GS countries and GN countries could no be ruled out over time, however it depends on the wealth and income distribution over the population in these countries.
However, these signs of convergence do not automatically imply a narrowing of the gap between the top and bottom deciles within countries. In many cases, economic growth enhances the role of capital income and skill-enhancing technological change, potentially widening the gap between income extremes across deciles. Therefore, the key question is not just "how fast are we growing economically" but also what is the structure of growth, which investments dominate, and how strong are the domestic institutions that translate growth into access to opportunity.
For countries in the Global North, the central challenge is maintaining social cohesion in the face of rising asset prices and labor market polarization. For BRICS+ and Global South countries, the primary challenge is accelerating productivity growth while creating institutional conditions under which investment and modernization generate broad employment effects, improve education and health outcomes, and support social mobility. In this sense, the analysis of gaps between deciles naturally leads to the broader issue of how different trajectories of development of the bloc structure are and how the benefits of growth are distributed between society and the elites.
References
- Ahmad, S. 2025. “Income, Employment, and Housing Inequalities in Asian and African Cities.” In Urban Inequality in the Global South, edited by Y. P. Wang, D. Rukmana, and S. Ahmad, 349–379. Singapore: Springer. https://doi.org/10.1007/978-981-96-5629-5_14.
- Carocci, S. 2011. “Social Mobility and the Middle Ages.” Continuity and Change 26 (3): 367–404. https://doi.org/10.1017/S0268416011000257.
- Dollar, D. 2005. “Globalization, Poverty, and Inequality since 1980.” The World Bank Research Observer 20 (2): 145–175. https://doi.org/10.1093/wbro/lki008.
- Lindert, P. H., and S. Nafziger. 2014. “Russian Inequality on the Eve of Revolution.” The Journal of Economic History 74 (3): 767–798. https://doi.org/10.1017/S002205071400059X.
- Ncwadi, R. 2025. “Rising Inequality or Regional Strength? Investigating Income Growth Divergence among BRICS Nations.” International Journal of Economics and Financial Issues 15 (6): 412–424. https://doi.org/10.32479/ijefi.20595.
- Ndubuisi, G., and S. Owusu. 2023. “Trade for Catch-Up: Examining How Global Value Chains Participation Affects Productive Efficiency.” Journal of Productivity Analysis 59: 195–215. https://doi.org/10.1007/s11123-023-00663-6.
- Ofori, P. E., C. B. Kuuwill, and S. K. Kutor. 2024. “Effect of Human Capital Development and Institutional Quality on Inclusive Growth in African Countries.” Cogent Economics & Finance 12 (1): 2357155. https://doi.org/10.1080/23322039.2024.2357155.
- Oxfam. 2024. Inequality Inc. Oxford: Oxfam GB. https://doi.org/10.21201/2024.000007.
- Palme, J. 2006. “Welfare States and Inequality: Institutional Designs and Distributive Outcome.” Research in Social Stratification and Mobility 24 (4): 387–403. https://doi.org/10.1016/j.rssm.2006.10.004.
- Piketty, T., and G. Zucman. 2014. “Capital Is Back: Wealth-Income Ratios in Rich Countries, 1700–2010.” The Quarterly Journal of Economics 129 (3): 1255–1310. https://doi.org/10.1093/qje/qju018.
- Seniuk, N. 2019. “BRICS Countries in Global Value Chains.” Strategic Analysis 43 (6): 509–531. https://doi.org/10.1080/09700161.2019.1669900.
- Sitthiyot, T., and K. Holasut. 2020. “A Simple Method for Measuring Inequality.” Humanities and Social Sciences Communications 7: 103. https://doi.org/10.1057/s41599-020-0484-6.
- UBS. 2025. Global Wealth Report 2025. Zurich: UBS Switzerland AG. https://www.ubs.com/global/en/wealthmanagement/insights/global-wealth-report.html.
- ANNEX 1:
- Breusch and Pagan Lagrangian multiplier test for random effects
- GDP_cap[ID_count,t] = Xb + u[ID_count] + e[ID_count,t]
- Estimated results:
- | Var SD = sqrt(Var)
- ---------+-----------------------------
- GDP_cap | 1.396254 1.181632
- e | .0223217 .1494043
- u | .8829713 .9396655
- Test: Var(u) = 0
- chibar2(01) = 50312.51
- Prob > chibar2 = 0.0000